Dashboard
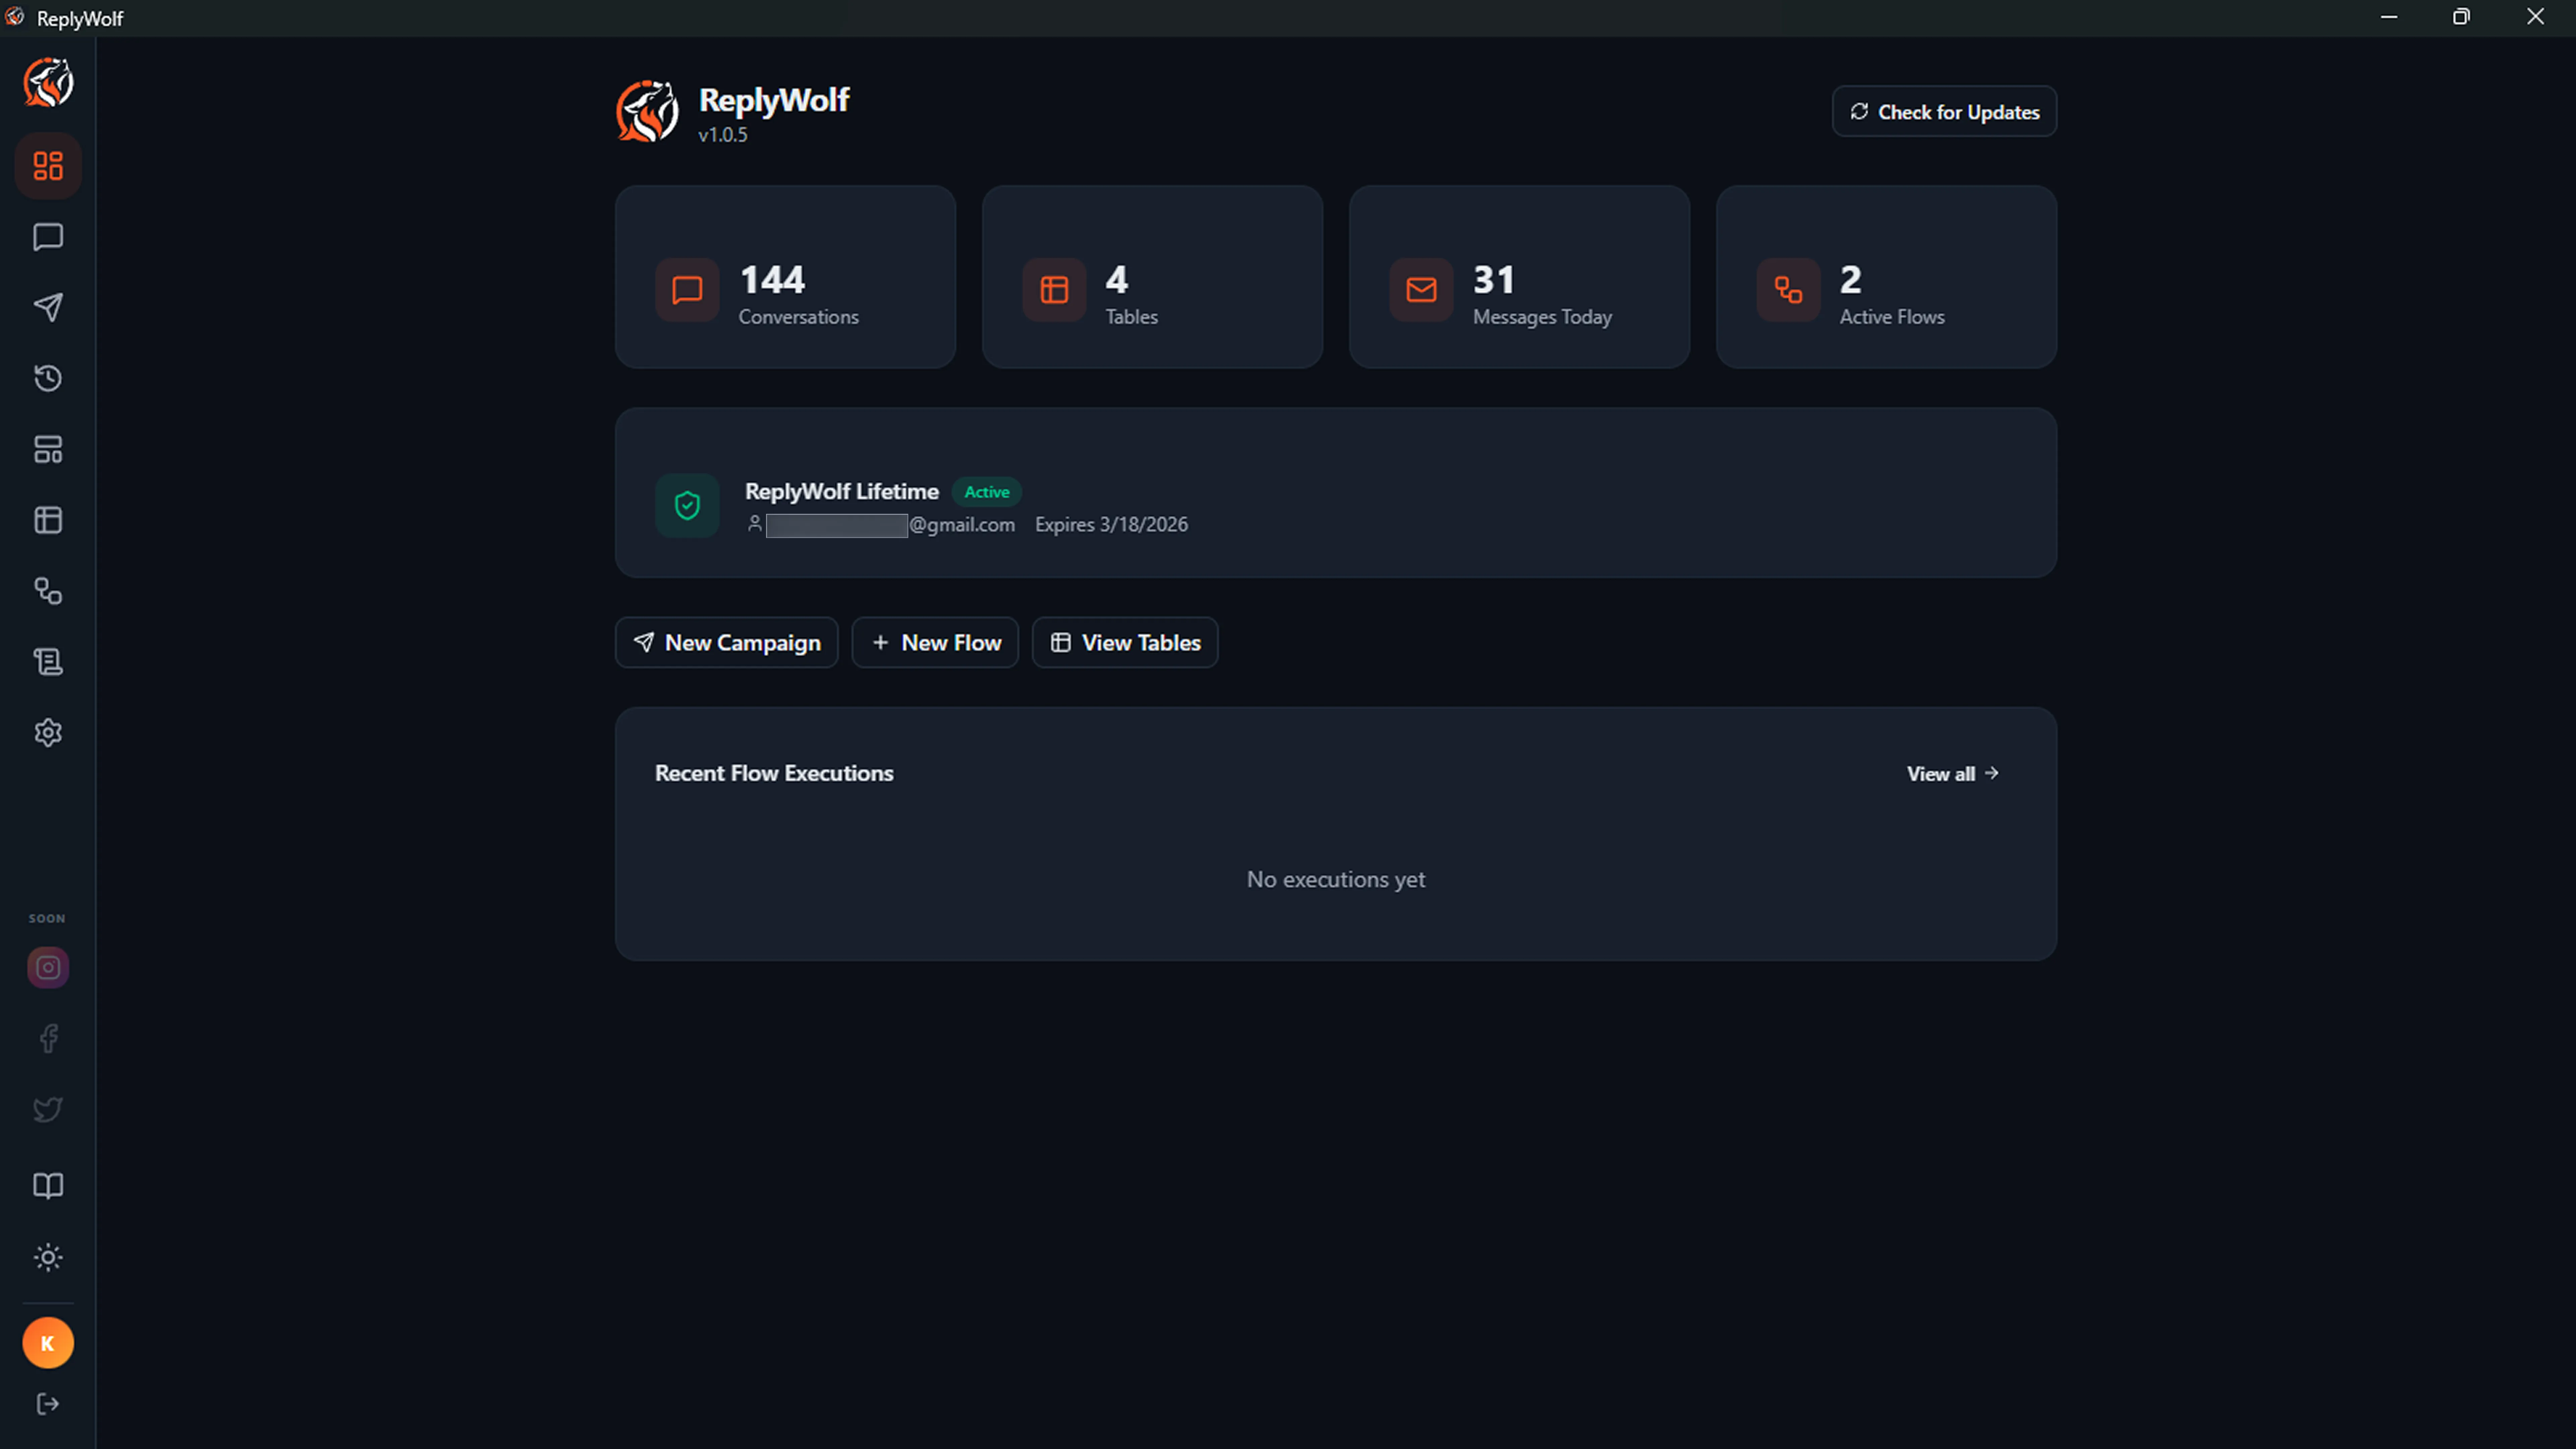
The Dashboard is the first page you see after signing in. It gives you a quick overview of your account activity, lets you check for updates, and provides shortcuts to common tasks.
Filters
At the top of the Dashboard, you can filter the data shown across all stats and charts.
Date Range
Choose a time period using the preset buttons:
- Today -- Only today's data
- 7 days -- Last 7 days
- 30 days -- Last 30 days
- All time -- No date filter (shows everything)
You can also set a custom date range using the date inputs.
Account Filter
If you have two or more connected WhatsApp accounts, an account dropdown appears. Select a specific account to see stats for just that account, or leave it on All accounts for the combined view.
Stats Cards
At the top of the Dashboard, four stat cards show key numbers at a glance. All cards respect the active date range and account filters.
| Card | What It Shows |
|---|---|
| Conversations | Number of WhatsApp conversations in the selected period. Click to jump to the Messages page. |
| Tables | Number of tables you have created (not affected by filters). Click to jump to the Tables page. |
| Messages in Range | Messages sent or received in the selected date range. Shows "Messages Today" when no date filter is set. Click to jump to the Messages page. |
| Active Flows | Number of automation flows currently turned on (filtered by account if selected). Click to jump to the Flows page. |
Message Trends
Below the stat cards, a trend chart shows your message volume over the selected time period.
- Daily / Weekly toggle -- Switch between daily and weekly aggregation
- Sent messages shown in green, received messages in blue
- The chart auto-scales to your data and shows the date on the X-axis
- A summary line below the chart shows the total sent and received counts for the period
If there are no messages in the selected period, a "No messages in selected period" notice is shown instead.
Version and Update Checking
The top-right corner of the Dashboard shows your current ReplyWolf version number and an update control:
- Check for Updates -- Click this button to check if a newer version is available.
- Up to date -- A green checkmark appears if you are running the latest version.
- Downloading -- When an update is found, it downloads automatically. A progress percentage is displayed.
- Install -- Once the download finishes, an install button appears. Click it to restart ReplyWolf and apply the update.
If an update check fails, an error message is shown. You can try again by clicking the button.
License Info
Below the stat cards, a license card shows your account details:
- Plan name -- The name of your ReplyWolf plan (for example, "Pro" or "Starter").
- Status -- Shows "Active" when your license is valid.
- Email -- The email address associated with your license.
- Expiration -- The date your license expires, or "Lifetime access" if you have a lifetime plan.
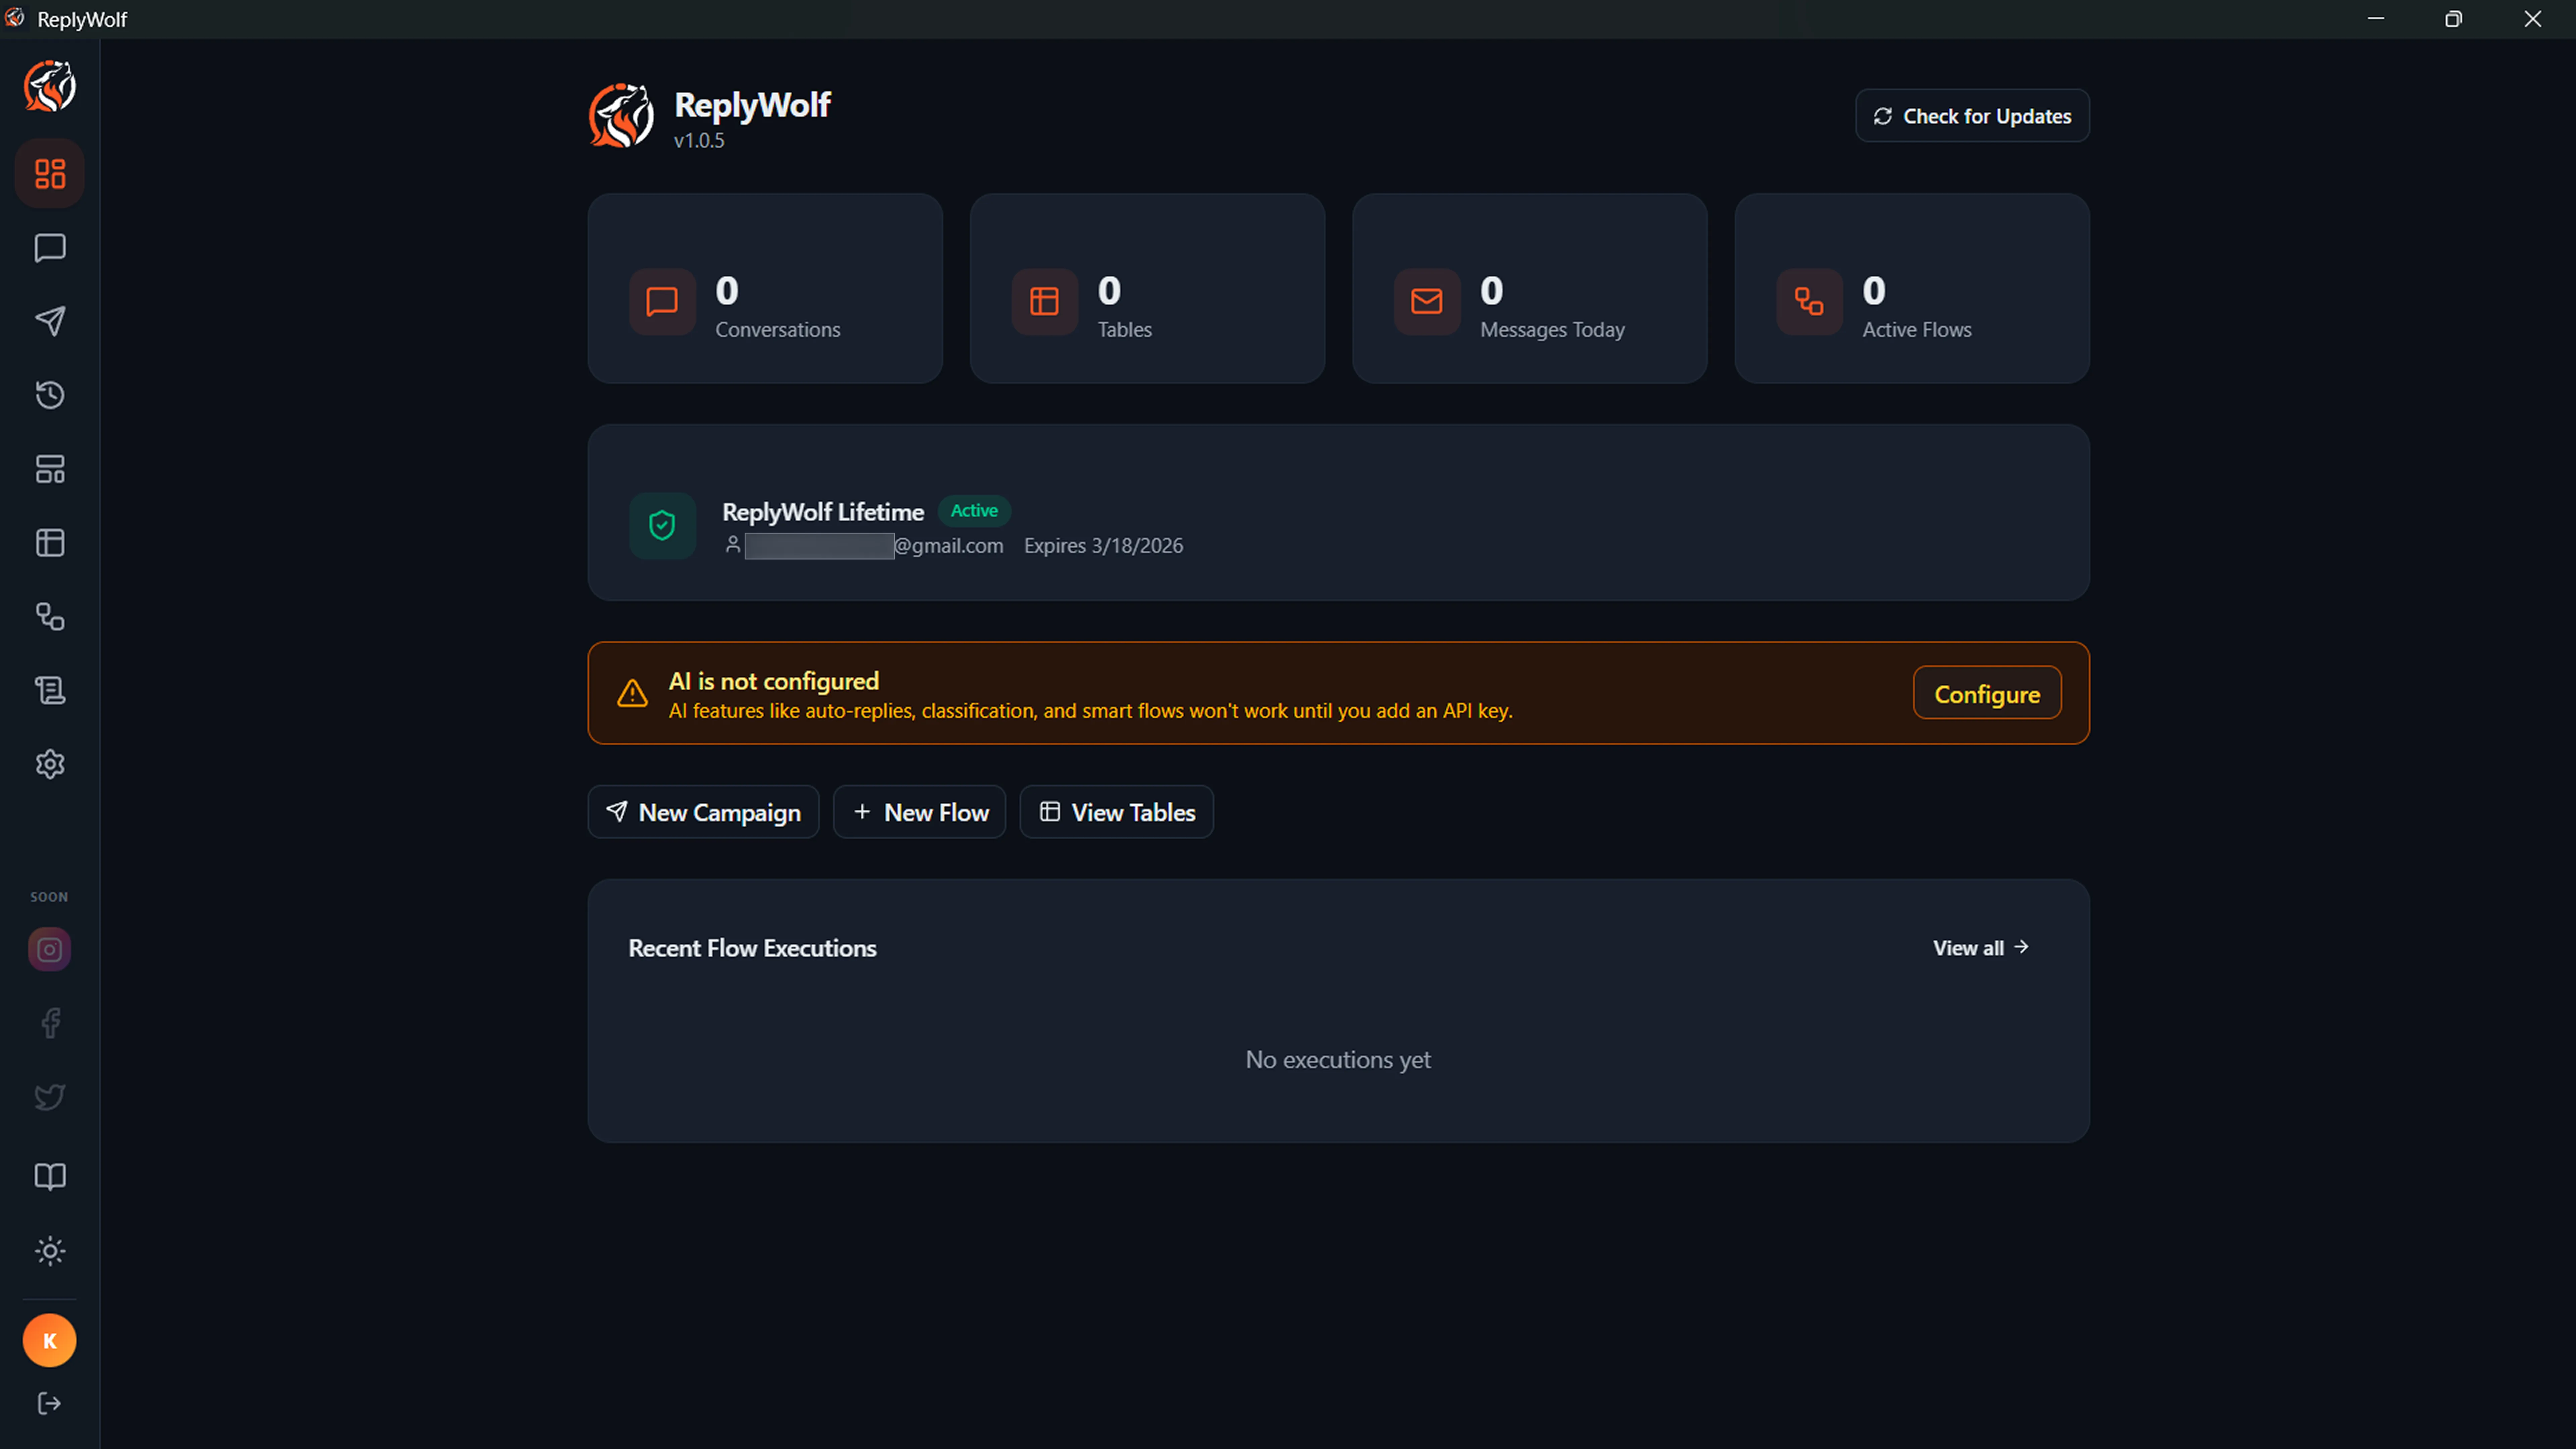
AI Configuration Warning
If you have not set up an AI provider yet, a yellow warning banner appears on the Dashboard:
AI is not configured AI features like auto-replies, classification, and smart flows won't work until you add an API key.
Click the Configure button to go directly to Settings, where you can enter your API key for OpenAI, Anthropic, Groq, Gemini, or Kimi.
This warning disappears once you have saved a valid API key.
Quick Action Buttons
Three shortcut buttons let you jump into common tasks without navigating through the sidebar:
- New Campaign -- Opens the campaign creation page to start a new bulk message campaign.
- New Flow -- Opens the Flows page where you can create a new automation flow.
- View Tables -- Opens the Tables page to browse and manage your data.
Recent Flow Executions
At the bottom of the Dashboard, a table shows your most recent flow executions. Each row displays:
| Column | Description |
|---|---|
| Flow | The name of the flow that ran. Shows "Deleted flow" if the flow has been removed. |
| Status | The outcome: completed, completed with errors, failed, running, or cancelled. Color-coded for quick scanning. |
| Sent | Number of messages successfully sent during this execution. |
| Failed | Number of messages that failed to send. |
| When | How long ago the execution happened (for example, "5m ago" or "2d ago"). |
Click View all to open the Logs page, which shows the complete execution history with more detail.
